
Retirement Calculator: How Much Money Do You Actually Need to Retire?
Most people open a retirement calculator, type in a random savings goal, and close the tab more confused than when they started. The tool isn’t broken — the inputs are wrong.
A retirement calculator is only as good as the assumptions behind it: your withdrawal rate, your life expectancy, your Social Security timing, and your actual spending. Get those wrong and the number on the screen means nothing.
Below are the real answers to the six questions people actually type into Google before they trust a calculator’s output — with the math shown, not just the result. If you’d rather run your own numbers as you read, our free retirement calculator projects your savings balance at retirement based on your current age, contributions, and expected return.
Table of Contents
- What Is a Retirement Calculator, and Why Do Most People Use It Wrong?
- How Much Money Do You Need to Retire With $100,000 a Year Income at 55?
- How Much Do You Have to Make to Get $3,000 a Month in Social Security?
- How Long Will $500,000 Last Using the 4% Rule?
- Who Has the Most Accurate Retirement Calculator?
- What Percentage of People Retire With $1,000,000?
- What Are the Biggest Retirement Mistakes?
- Frequently Asked Questions
- Sources
What Is a Retirement Calculator, and Why Do Most People Use It Wrong?
A retirement calculator estimates how much you need saved by working backward from your desired income, your expected withdrawal rate, and how long that money has to last. The two most common models are:
- The 4% rule — withdraw 4% of your portfolio in year one, then adjust that dollar amount for inflation every year after. Built to survive roughly 30 years.
- Monte Carlo simulation — runs your plan through thousands of randomized market scenarios instead of one fixed average return, giving you a probability of success rather than a single number.
The mistake most people make is treating the calculator’s output as a fixed target instead of a starting estimate that needs to move as your spending, health, and market conditions change.
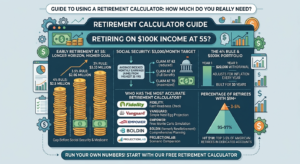
How Much Money Do You Need to Retire With $100,000 a Year Income at 55?
This is the hardest version of the question because retiring at 55 means your money has to last longer — likely 35 to 40 years instead of the standard 30 — and you won’t have Social Security or Medicare for at least seven years.
Using the standard 4% rule, $100,000 a year requires $2.5 million invested (100,000 ÷ 0.04).
But because you’re retiring early, most planners recommend a more conservative withdrawal rate of 3% to 3.5% to account for the longer time horizon and the gap before Social Security kicks in. At those rates:
| Withdrawal rate | Portfolio needed for $100,000/year |
|---|---|
| 4% (standard rule) | $2,500,000 |
| 3.5% (early retirement, moderate) | $2,860,000 |
| 3% (early retirement, conservative) | $3,330,000 |
Two things change this number in either direction:
- If part of the $100,000 will eventually come from Social Security or a pension, you need less invested today — you’re only funding the gap years plus the portion Social Security won’t cover.
- If $100,000 is your gross spending target before taxes, remember that withdrawals from a traditional 401(k) or IRA are taxed as ordinary income, so you may need to withdraw more than $100,000 to net $100,000.
Bottom line: for a genuine early retirement at 55 on $100,000 a year, plan for a portfolio between $2.86 million and $3.33 million, not the $2.5 million a generic 4%-rule calculator will show you. If you’re targeting an exit before 55 specifically, run the numbers through a FIRE calculator instead, since it’s built around that shorter accumulation window.
How Much Do You Have to Make to Get $3,000 a Month in Social Security?
Social Security doesn’t look at your current salary — it looks at your highest 35 years of earnings, adjusted for inflation, averaged into a figure called your Average Indexed Monthly Earnings (AIME). That AIME is then run through the Social Security Administration’s official benefit formula to produce your Primary Insurance Amount (PIA), which is what you receive at full retirement age (67 for anyone born in 1960 or later).
Based on current benefit formulas, reaching roughly $3,000 a month at full retirement age generally requires:
- Average career earnings of about $80,000–$108,000 a year, sustained over 35 years (adjusted for inflation each year). Earning near the Social Security taxable maximum for most of your career pushes your benefit well past $3,000; earning close to the national average earnings falls short of it.
- Claiming age matters as much as income. The same earnings history that produces roughly $2,850/month at full retirement age can produce over $3,700/month if you delay claiming until 70. Conversely, claiming at 62 cuts your benefit by up to 30%.
- Missing years hurt you. Social Security counts zero-income years toward your 35-year average if you have fewer than 35 years of earnings, which drags the average down significantly.
Bottom line: there’s no single income figure that guarantees $3,000 a month — it’s a combination of consistent six-figure-adjacent earnings over three-plus decades and a claiming strategy that doesn’t leave money on the table. Our Social Security calculator walks through this with your own earnings history instead of a rough average.
How Long Will $500,000 Last Using the 4% Rule?
The 4% rule is built to answer exactly this question. Applied to $500,000:
$500,000 × 4% = $20,000 in year one, increased each subsequent year to keep pace with inflation.
Under the historical assumptions the rule was built on (a diversified 50/50 to 60/40 stock-and-bond portfolio), $500,000 withdrawn this way is designed to last approximately 30 years in the majority of historical market scenarios.
What actually determines whether it lasts:
- Market sequence in the first 5–10 years. A market downturn early in retirement does far more damage than the same downturn ten years in, because you’re selling shares at depressed prices while the balance is still high.
- Your actual withdrawal rate. If $20,000 a year isn’t enough to live on and you pull $30,000–$35,000 instead (a 6–7% rate), the portfolio can be depleted in 15–20 years rather than 30.
- Other guaranteed income. If Social Security or a pension covers your baseline expenses, $500,000 can last considerably longer because you’re not relying on it for 100% of your spending.
Bottom line: $500,000 under a strict 4% withdrawal supports about $20,000 of inflation-adjusted annual income for roughly 30 years — not indefinitely, and not if withdrawals run higher than that. To see how a different starting balance or contribution rate changes that runway, our retirement savings calculator projects the balance itself, not just the withdrawal phase.
Who Has the Most Accurate Retirement Calculator?
There’s no single “most accurate” calculator — accuracy depends on which variables a tool actually models, not its brand name. Here’s how the major free and paid options compare:
| Tool | Best for | Main limitation |
|---|---|---|
| Fidelity Retirement Score | A fast, five-minute readiness check | Uses flat assumptions; doesn’t model taxes, Roth conversions, or Social Security timing |
| Vanguard Retirement Nest Egg Calculator | Simple 4%-rule-based projection | Limited scenario modeling |
| Empower (formerly Personal Capital) | Free Monte Carlo simulation on linked real accounts | Weaker on tax-aware withdrawal sequencing |
| Boldin (formerly NewRetirement) | Comprehensive planning — Social Security timing, Roth conversions, 250+ inputs | Free tier is limited; full features are a paid subscription |
| ProjectionLab | Scenario comparison and historical backtesting without linking accounts | Steeper learning curve for beginners |
| FIRECalc / cFIREsim | Testing a plan against every real market period since 1871 | No tax modeling or Social Security optimization |
The realistic answer: use a quick tool (Fidelity or Vanguard) for a gut check, then a deeper tool (Boldin, Empower, or ProjectionLab) once you’re within five to ten years of retiring and the decisions — Social Security timing, Roth conversions, withdrawal order — actually start to matter.
What Percentage of People Retire With $1,000,000?
Fewer than most people assume. According to the Federal Reserve’s Survey of Consumer Finances, only around 3% to 5% of American retirees have $1 million or more saved specifically in retirement accounts such as 401(k)s and IRAs.
Some additional context that puts that figure in perspective:
- The median retirement savings for households aged 65–74 is roughly $200,000 — far below the average of over $600,000, because a small number of high savers pull the average up.
- For households 75 and older, the median drops to around $130,000.
- Roughly 1 in 5 Americans aged 50+ report having no retirement savings at all.
- Including non-retirement assets like home equity, the share of households with $1 million or more in total net worth is considerably higher — but the question of who has $1 million specifically saved for retirement is a much smaller group.
Bottom line: hitting $1 million in dedicated retirement savings puts you ahead of roughly 95% of American retirees — it’s a meaningful milestone, not the baseline most people assume it is.
What Are the Biggest Retirement Mistakes?
The costliest mistakes aren’t dramatic — they’re small decisions compounded over decades.
- Claiming Social Security too early. Claiming at 62 instead of full retirement age locks in a permanent reduction of up to 30%, for the rest of your life.
- Underestimating healthcare costs. A 65-year-old retiring today can expect to spend well over $150,000 out of pocket on healthcare over the course of retirement — a figure most people’s plans don’t account for.
- Ignoring sequence-of-returns risk. Retiring into a market downturn and continuing to withdraw a fixed amount can permanently damage a portfolio in a way that the same downturn wouldn’t if it happened later.
- No tax diversification. Holding all retirement savings in tax-deferred accounts (traditional 401k/IRA) means every withdrawal is taxed as ordinary income, with no flexibility to manage tax brackets in retirement — splitting savings with a Roth IRA is one of the more common fixes.
- Retiring earlier than planned due to health or job loss. A large share of retirees leave the workforce years before they intended to, often without adjusting their savings plan for the shorter accumulation period.
- Carrying high-interest debt into retirement. A large share of retirees still carry non-mortgage debt, which eats directly into fixed retirement income.
- Never running the numbers at all. The most common mistake isn’t a bad calculation — it’s not calculating anything and hoping a “safe-sounding” number like $1 million is automatically enough for your specific spending, or forgetting to add a pension into the total picture if one applies to you.
Frequently Asked Questions
How much money do I need to retire with $100,000 a year at 55? Between $2.5 million (standard 4% rule) and $3.33 million (conservative 3% rate recommended for early retirees), depending on how much of that income will eventually be replaced by Social Security.
How much do I need to make to get $3,000 a month in Social Security? Roughly $80,000–$108,000 a year in average, inflation-adjusted earnings sustained over 35 years, combined with claiming at or after full retirement age.
How long will $500,000 last using the 4% rule? About 30 years, generating approximately $20,000 in year one, adjusted upward each year for inflation.
Who has the most accurate retirement calculator? No single tool is universally “most accurate.” Fidelity and Vanguard are best for quick checks; Boldin, Empower, and ProjectionLab offer deeper Monte Carlo and tax modeling for detailed planning.
What percentage of people retire with $1,000,000? Roughly 3% to 5% of American retirees have $1 million or more saved specifically in retirement accounts.
What are the biggest retirement mistakes? Claiming Social Security too early, underestimating healthcare costs, ignoring market sequence risk, lacking tax diversification, and never actually running the numbers before deciding a savings target is “enough.”
Sources
- Social Security Administration — Benefit Calculation Formula
- Federal Reserve — Survey of Consumer Finances
The Real Takeaway
A retirement calculator is a starting point, not a verdict. The number it gives you is only as accurate as the withdrawal rate, retirement age, and income assumptions you feed into it. Run your own numbers with more than one tool — start with our free retirement calculator — revisit them every few years, and treat every “you need $X to retire” headline — including the ones above — as a range, not a guarantee.